 CUPiD Diagnostics Tutorial
  #
#
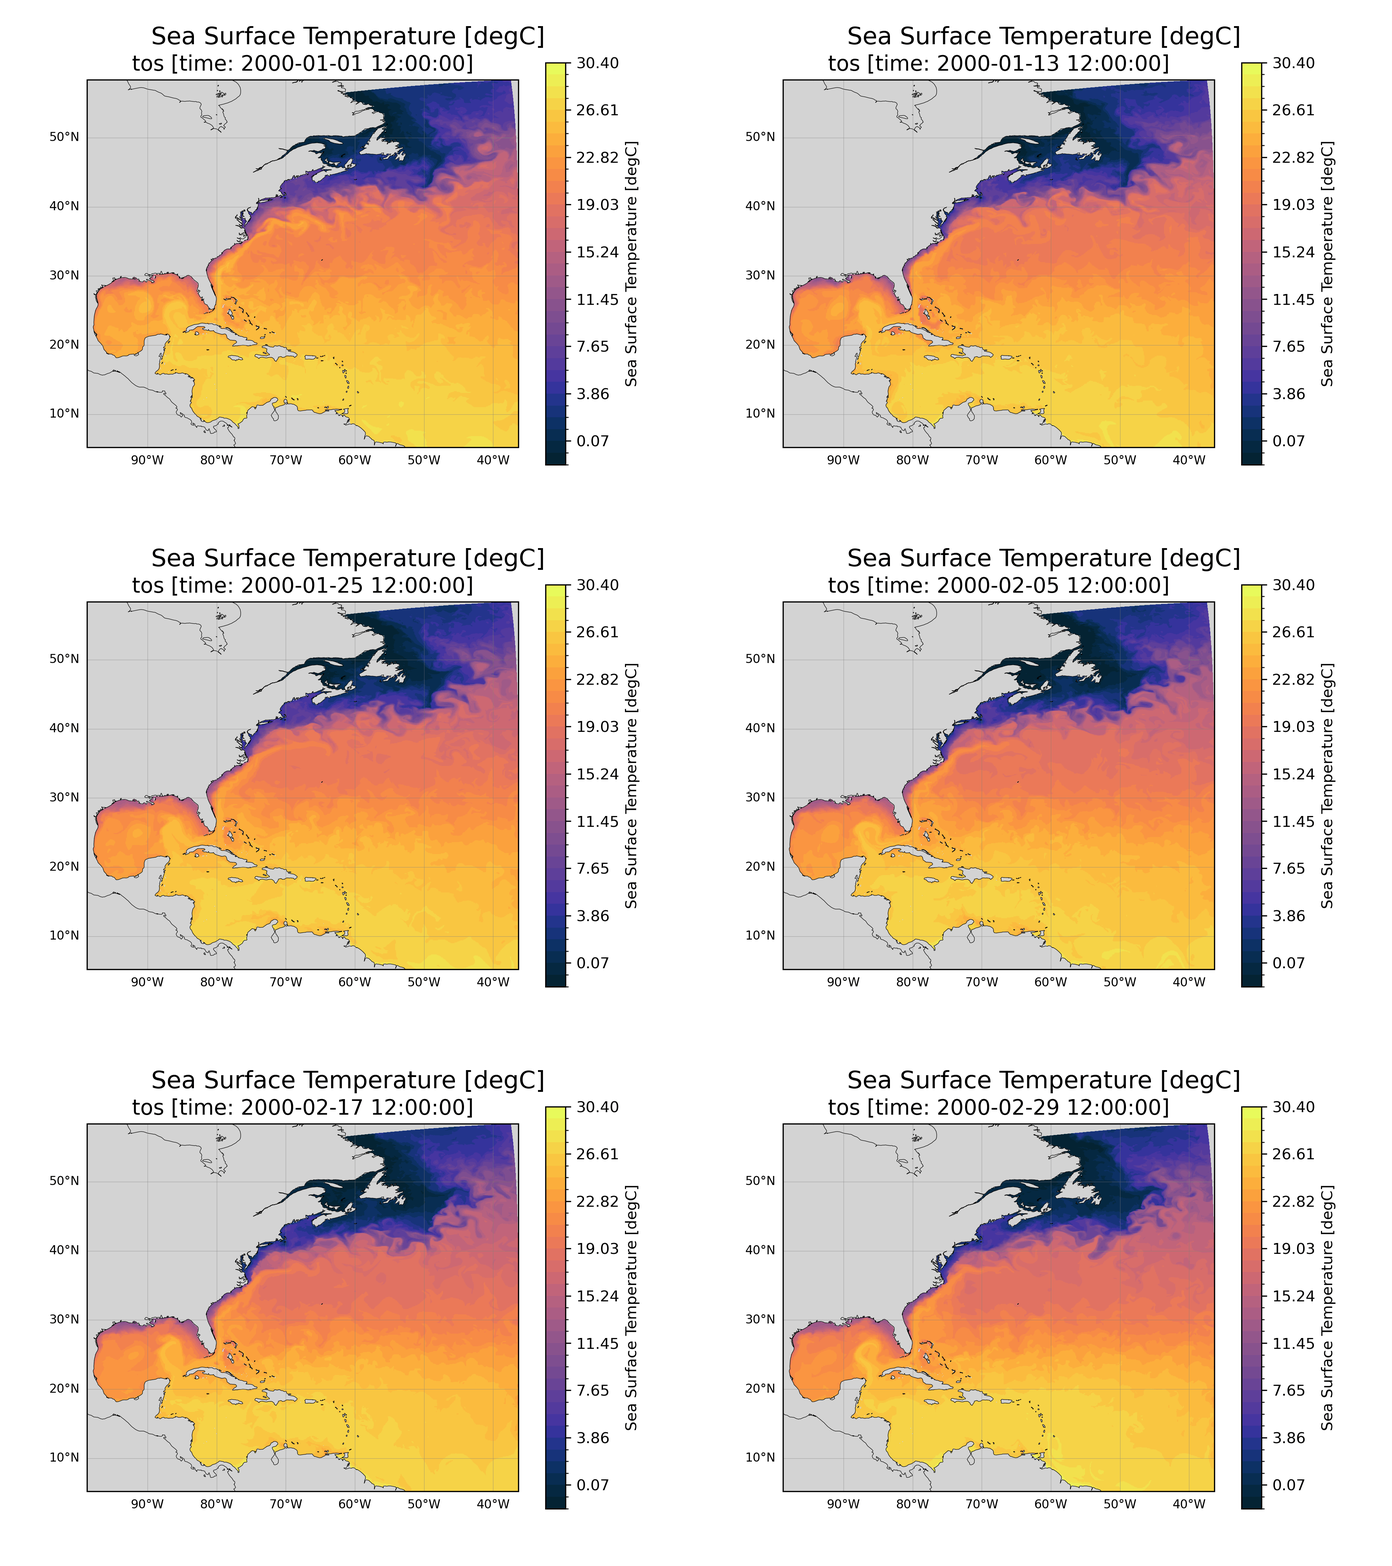
 Goal: In this tutorial, you’ll learn how to make the above animation (and other diagnostic plots).
Warm up the Engine – Start a JupyterHub Server
If you are not already logged into jupter.hub.ucar.edu , please navigate there and start a new server.
Required Settings
- Resource Selection: Casper PBS Batch
- Queue or Reservation: tutorial
- Project Account: CESM0030 ...
- Specify Memory per Node in GB: 20
CESM3 includes the CESM Unified Postprocessing and Diagnostics (CUPiD) python framework. Development is guided by its vision statement:
CUPiD is a “one stop shop” that enables and integrates timeseries file generation, data standardization, diagnostics, and metrics from all CESM components.
This collaborative effort aims to simplify the user experience of running diagnostics by calling post-processing tools directly from CUPiD, running all component diagnostics from the same tool as either part of the CIME workflow or independently, and sharing python code and a standard conda environment across components.
CUPiD for Regional MOM6#
CUPiD is a broad package designed to pull many independent tasks together and standardize common parts of the CESM postprocessing workflow. For postprocessing, CUPiD is automating the process of converting CESM output to the standard format required for the Coupled Model Intercomparison Project (CMIP).
This tutorial is going to focus on the diagnostic side of CUPiD and tools for accessing and manipulating MOM6 output. CUPiD is designed to make it easy for users to run existing notebooks to look at output from all components of CESM, but we will focus on a set of MOM6 notebooks meant to analyze regional runs. Participants will install CUPiD and then familiarize themselves with it by looking at diagnostics from an existing regional MOM6 run in stand-alone mode. During project worktime there are also instructions for
running the same diagnostics on a user-generated regional MOM6 run (with CESM integration), and
contributing more diagnostics to the CUPiD project.
Your Turn!#
As we progress through this tutorial, think about what kinds of diagnostics might be helpful for general regions and your specific regions of interest.
Ideas for New Notebooks#
This is a brief list of some possible topics/notebooks to contribute from a regional ocean perspective. Add your own!
Comparison to Other Model Output/Reanalysis Products: compare model output to other model output or a reanalysis product (Global Atmspheric Observations Example). CUPiD is already setup with this in mind with the
base_caseglobal parameters.Transport through Passages: MOM6 lets you define transects to calculate transport through different passages. These transects are defined in the
diag_tableso a notebook would need to chek if any transects are defined and then visualize/analyze them appropriately. Comparing to observations could be tricky and very helpful!Region Aware Diagnostics: Different regions might benefit from a different standard sets of diagnostics. Even simple adjustments like choosing a different projection for plotting or looking at sea ice in the arctic.
