Use Custom Pre-Generated Grids#
Step 1.1: Horizontal Grid#
from CrocoDash.grid import Gridx

grid = Grid.from_supergrid("s3://crocodile-cesm/CrocoDash/data/grids/ocean_hgrid_trimmed.nc")
Step 1.2: Topography#
from CrocoDash.topo import Topo

bathymetry_path='s3://crocodile-cesm/CrocoDash/data/grids/ocean_topog_little_nwa12_5d22b5.nc'

topo = Topo.from_topo_file(
    grid = grid,
    topo_file_path=bathymetry_path,
    min_depth = 5,
)
topo.depth.plot()
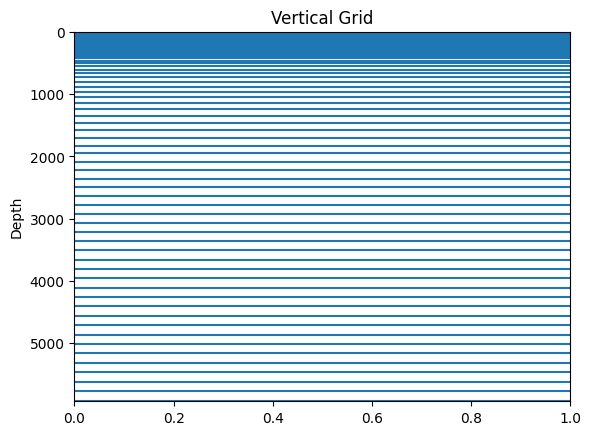
Step 1.3: Vertical Grid#
from CrocoDash.vgrid import VGrid

vgrid_path='<YOUR_VGRID_PATH>'

vgrid  = VGrid.from_file(vgrid_path)
import matplotlib.pyplot as plt
# Create the plot
for depth in vgrid.z:
    plt.axhline(y=depth, linestyle='-')  # Horizontal lines

plt.ylim(max(vgrid.z) + 10, min(vgrid.z) - 10)  # Invert y-axis so deeper values go down
plt.ylabel("Depth")
plt.title("Vertical Grid")
plt.show()