Step 1.1: Horizontal Grid
from CrocoDash.grid import Grid

grid = Grid.from_supergrid("<NWA_HGRID>")
Step 1.2: Topography
from CrocoDash.topo import Topo

bathymetry_path='<NWA_BATHY>'

topo = Topo.from_topo_file(
    grid = grid,
    topo_file_path=bathymetry_path,
    min_depth = 5,
)topo.depth.plot()Step 1.3: Vertical Grid
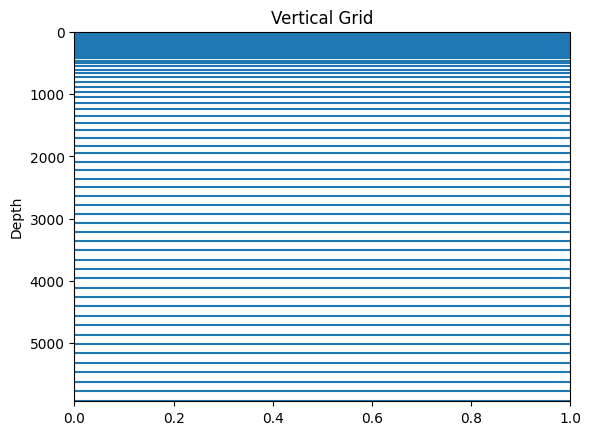
from CrocoDash.vgrid import VGrid

vgrid_path='<NWA_VGRID>'

vgrid  = VGrid.from_file(vgrid_path)
import matplotlib.pyplot as plt
# Create the plot
for depth in vgrid.zi:
plt.axhline(y=depth, linestyle='-') # Horizontal lines
plt.ylim(max(vgrid.zi) + 10, min(vgrid.zi) - 10) # Invert y-axis so deeper values go down
plt.ylabel("Depth")
plt.title("Vertical Grid")
plt.show()